
 ELK stack
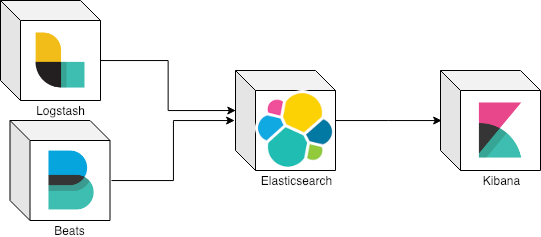
ELK It’s the abbreviation of a technology stack used abroad for most medium/big size companies nowadays. ELK means:
-
Elasticsearch
-
Logstash
-
Kibana
In case you already an expert in ELK, you can probably go to the end of this article where it has an example of usage with Kafka or enjoy the read.
Elasticsearch
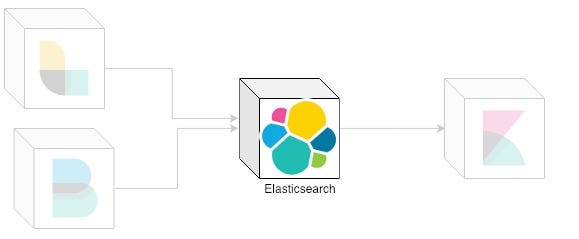 Elasticsearch in ELK stack
Elasticsearch is a highly scalable open-source full-text search and analytics engine. It allows you to store, search, and analyze big volumes of data quickly and in near real time. It is generally used as the underlying engine/technology that powers applications that have complex search features and requirements.
Elasticsearch has 6 basic concepts:
-
Near Real-time (NRT): near real-time search platform means that exist a slight latency (normally one second) from the time you index a document until the time it becomes searchable.
-
**Cluster: **is a collection of one or more nodes (servers) that together holds your entire data and provides federated indexing and search capabilities across all nodes.
-
Node: is a single server that is part of your cluster, stores your data, and participates in the cluster’s indexing and search capabilities.
-
Index: is a collection of documents that have somewhat similar characteristics.
-
Document: is a basic unit of information that can be indexed. This document is expressed in JSON (JavaScript Object Notation) which is a ubiquitous internet data interchange format.
-
Shards & Replicas: each index can be split into multiple shards. An index can also be replicated zero (meaning no replicas) or more times. Once replicated, each index will have primary shards (the original shards that were replicated from) and replica shards (the copies of the primary shards).
Logstash
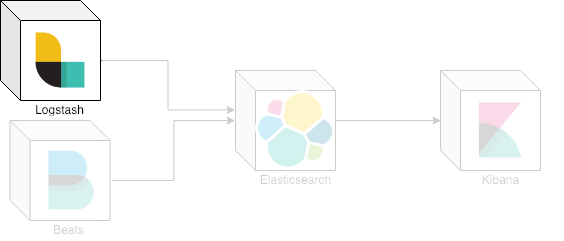 Logstash in ELK stack
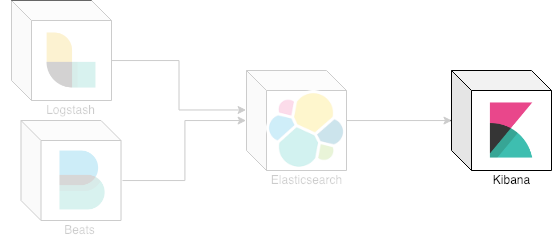
Logstash is a light-weight, open-source, server-side data processing pipeline that allows you to collect data from a variety of sources, transform it on the fly, and send it to your desired destination through an event processing pipeline.
The event processing pipeline has three stages:
Inputs
You use inputs to get data into Logstash. Some of the more commonly-used inputs are:
-
file: reads from a file on the filesystem, much like the UNIX command tail -0F
-
syslog: listens on the well-known port 514 for syslog messages and parses according to the RFC3164 format
-
redis: reads from a redis server, using both redis channels and redis lists. Redis is often used as a “broker” in a centralized Logstash installation, which queues Logstash events from remote Logstash “shippers”.
-
beats: processes events sent by Beats.
Filters
Filters are intermediary processing devices in the Logstash pipeline. You can combine filters with conditionals to perform an action on an event if it meets certain criteria. Some useful filters include:
-
grok: parse and structure arbitrary text. Grok is currently the best way in Logstash to parse unstructured log data into something structured and queryable. With 120 patterns built-in to Logstash, it’s more than likely you’ll find one that meets your needs!
-
mutate: perform general transformations on event fields. You can rename, remove, replace, and modify fields in your events.
-
drop: drop an event completely, for example, debug events.
-
clone: make a copy of an event, possibly adding or removing fields.
-
geoip: add information about geographical location of IP addresses (also displays amazing charts in Kibana!)
Outputs
Outputs are the final phase of the Logstash pipeline. An event can pass through multiple outputs, but once all output processing is complete, the event has finished its execution. Some commonly used outputs include:
-
elasticsearch: send event data to Elasticsearch. If you’re planning to save your data in an efficient, convenient, and easily queryable format… Elasticsearch is the way to go. Period. Yes, we’re biased :)
-
file: write event data to a file on disk.
-
graphite: send event data to graphite, a popular open source tool for storing and graphing metrics. http://graphite.readthedocs.io/en/latest/
-
statsd: send event data to statsd, a service that “listens for statistics, like counters and timers, sent over UDP and sends aggregates to one or more pluggable backend services”. If you’re already using statsd, this could be useful for you!
Codecs
Inputs and outputs support codecs that enable you to encode or decode the data as it enters or exits the pipeline without having to use a separate filter. Codecs enable you to easily separate the transport of your messages from the serialization process. Popular codecs include json, msgpack, and plain (text).
Beats
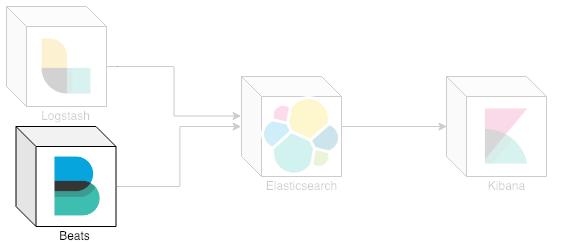 Beats in ELK stack
Beats are great for gathering data. They sit on your servers, with your containers, or deploy as functions — and then centralize data in Elasticsearch. And if you want more processing muscle, Beats can also ship to Logstash for transformation and parsing.
There are 7 different beats:
-
Auditbeat: collect your Linux audit framework data and monitor the integrity of your files.
-
Filebeat: tails and ships log files.
-
Functionbeat: read and ships events from serverless infrastructure.
-
Heartbeat: ping remote services for availability.
-
Journalbeat: read and ships event from Journald.
-
Metricbeat: fetches sets of metrics from the operating system and services.
-
Packetbeat: monitors the network and applications by sniffing packets.
-
Winlogbeat: fetches and ships Windows Event logs.
Kibana
 Kibana in ELK stack
Kibana is an open source analytics and visualization platform designed to work with Elasticsearch. You use Kibana to search, view, and interact with data stored in Elasticsearch indices. You can easily perform advanced data analysis and visualize your data in a variety of charts, tables, and maps.
Kibana makes it easy to understand large volumes of data. Its simple, browser-based interface enables you to quickly create and share dynamic dashboards that display changes to Elasticsearch queries in real time.
](https://cdn-images-1.medium.com/max/2000/1*dEffeE7DZ86Vy1mYVmeRDg.jpeg) “What about Kafka?” by imgflip
“What about Kafka?” by imgflip
Kafka
Apache Kafka is a distributed streaming platform. What exactly does that mean? A streaming platform has three key capabilities:
-
Publish and subscribe to streams of records, similar to a message queue or enterprise messaging system.
-
Store streams of records in a fault-tolerant durable way.
-
Process streams of records as they occur.
Kafka is generally used for two broad classes of applications:
-
Building real-time streaming data pipelines that reliably get data between systems or applications
-
Building real-time streaming applications that transform or react to the streams of data
To understand how Kafka does these things, let’s dive in and explore Kafka’s capabilities from the bottom up.
First a few concepts:
-
Kafka run as a cluster on one or more servers that can span multiple datacenters.
-
The Kafka cluster stores streams of records in categories called topics.
-
Each record consists of a key, a value, and a timestamp.
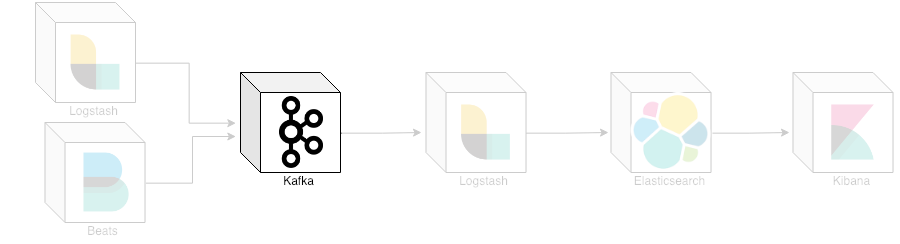
But which value Kafka can add to our stack?
 ELK stack with Kafka
Example of usage and minor configuration
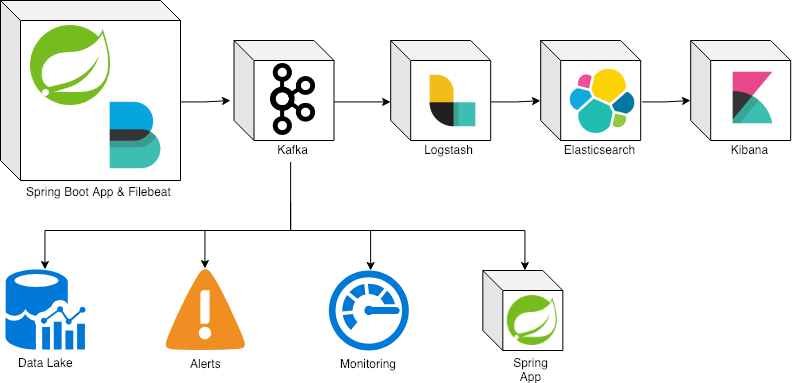 Full ecosystem example
Spring boot is configured with logback to generate logs in JSON format with field log and log_topic:
logback.xml
1
2
3
4
5
6
7
8
9
10
<configuration>
    <appender name="jsonConsoleAppender" class="ch.qos.logback.core.ConsoleAppender">
        <encoder class="net.logstash.logback.encoder.LogstashEncoder">
            <customFields>{"log_topic":"dummy-app"}</customFields>
        </encoder>
    </appender>
    <root level="INFO">
        <appender-ref ref="jsonConsoleAppender"/>
    </root>
</configuration>
This enables filebeat to extract the specific field JSON and send it to Kafka in a topic defined by the field log_topic:
filebeat.yml
1
2
3
4
5
6
7
8
9
10
11
12
13
14
15
16
17
18
19
20
21
22
23
24
25
26
27
28
29
30
31
32
33
34
35
36
37
38
39
40
41
filebeat.prospectors:
- type: log
  json.keys_under_root: true
  # Json key name, which value contains a sub JSON document produced by our application Console Appender
  json.message_key: log
  enabled: true
  encoding: utf-8
  document_type: docker
  paths:
    # Location of all our Docker log files (mapped volume in docker-compose.yml)
    - '/usr/share/filebeat/dockerlogs/data/*/*.log'
processors:
# decode the log field (sub JSON document) if JSONencoded, then maps it's fields to elasticsearch fields
- decode_json_fields:
    fields: ["log"]
    target: ""
    # overwrite existing target elasticsearch fields while decoding json fields
    overwrite_keys: true
- add_docker_metadata: ~

filebeat.config.modules:
  path: ${path.config}/modules.d/*.yml
  reload.enabled: false

setup.template.settings:
  index.number_of_shards: 3

output.kafka:
  # initial brokers for reading cluster metadata
  hosts: ["localhost:9092"]
  # message topic selection + partitioning
  topic: '%{[log_topic]:dummy}-log'
  partition.round_robin:
    reachable_only: false
  required_acks: 1
  compression: gzip
  max_message_bytes: 1000000

# Write Filebeat own logs only to file to avoid catching them with itself in docker log files
logging.to_files: true
logging.to_syslog: false
With the events now in Kafka, logstash is able to consume by topic and send to Elasticsearch:
logstash.conf
1
2
3
4
5
6
7
8
9
10
11
12
13
14
15
input {
    kafka {
            bootstrap_servers => "localhost:9092"
            topics_pattern => [".*"]
    }
}

output {
    elasticsearch {
        hosts => ["localhost:9200"]
        index => "logstash"
        document_type => "logs"
    }
    stdout { codec => rubydebug }
}
Once in Elasticsearch we can normally make queries in Kibana.
This all can be started with docker-compose. Here you can check the full example: alexrochas/kafka-centralized_logs
](https://cdn-images-1.medium.com/max/2458/1*a67reU9VyN1HeS_Rszx8VA.jpeg) “Elks in the wild” by outdoorcanada
“Elks in the wild” by outdoorcanada
ELK stack is something common nowadays, but the constant need for a decoupled environment architecture in order to be reactive to problems and troubleshooting makes Kafka the best company to this stack.
Pros
-
Decoupled architecture
-
Any team can subscribe to Kafka in order to collect metrics or emit alarms
-
Elasticsearch + Kibana is used only for consult purposes, not alerts or monitoring
Cons
-
Crescent complexity
-
One more technology to maintain
Speed dating questions
Example of usage?
Emit events for monitoring and health check have a high cost and are not atomic since you have to do an action and emit the event. Going to an ELK stack with Kafka you don’t depend on your monitoring in emitted events.
Which is the difference between logstash and beats?
Beats are lightweight data shippers that you install as agents on your servers to send specific types of operational data to Elasticsearch. Beats have a small footprint and use fewer system resources than Logstash.
Logstash has a larger footprint but provides a broad array of input, filter, and output plugins for collecting, enriching, and transforming data from a variety of sources.
Why I cannot use only logstash to collect input and send to output?
You can, but mostly because the best approach is ship filebeat with your container since logstash has a higher cost to your system.
Why you should ship filebeat with your service container?
Filebeat with Kafka has the benefit of create different topics per service. This way you can generate different topics per service, improving the reactive aspect of your systems.
Thank you for reading until the end. This post is strongly based on the official documentation of each product.
Which other use this approach could have and which drawbacks I did not list here?
